Allen Tran

Probabilistic PCA for Forecasting
Feb 21, 2015
Back when I was a central banker at the Reserve Bank of Australia, a common joke and uncomfortable truth was that “you only need 2 people to run the RBA. Tony Richards and someone else to make the charts.” Tony Richards was great at ingesting a ton of data and making forecasts that had a coherent narrative, consistent with economic theory.
Looking back, it puzzles me that professional economists cared and still care so much about economic theory. Economic theory is a prior that allows us to restrict our attention to a subset of the data seemingly without cost. But with modern computing power and sensible modelling choices, we should be beyond that. Otherwise we're just restricting models to the current state of theory which is an unverifiable degree behind reality.
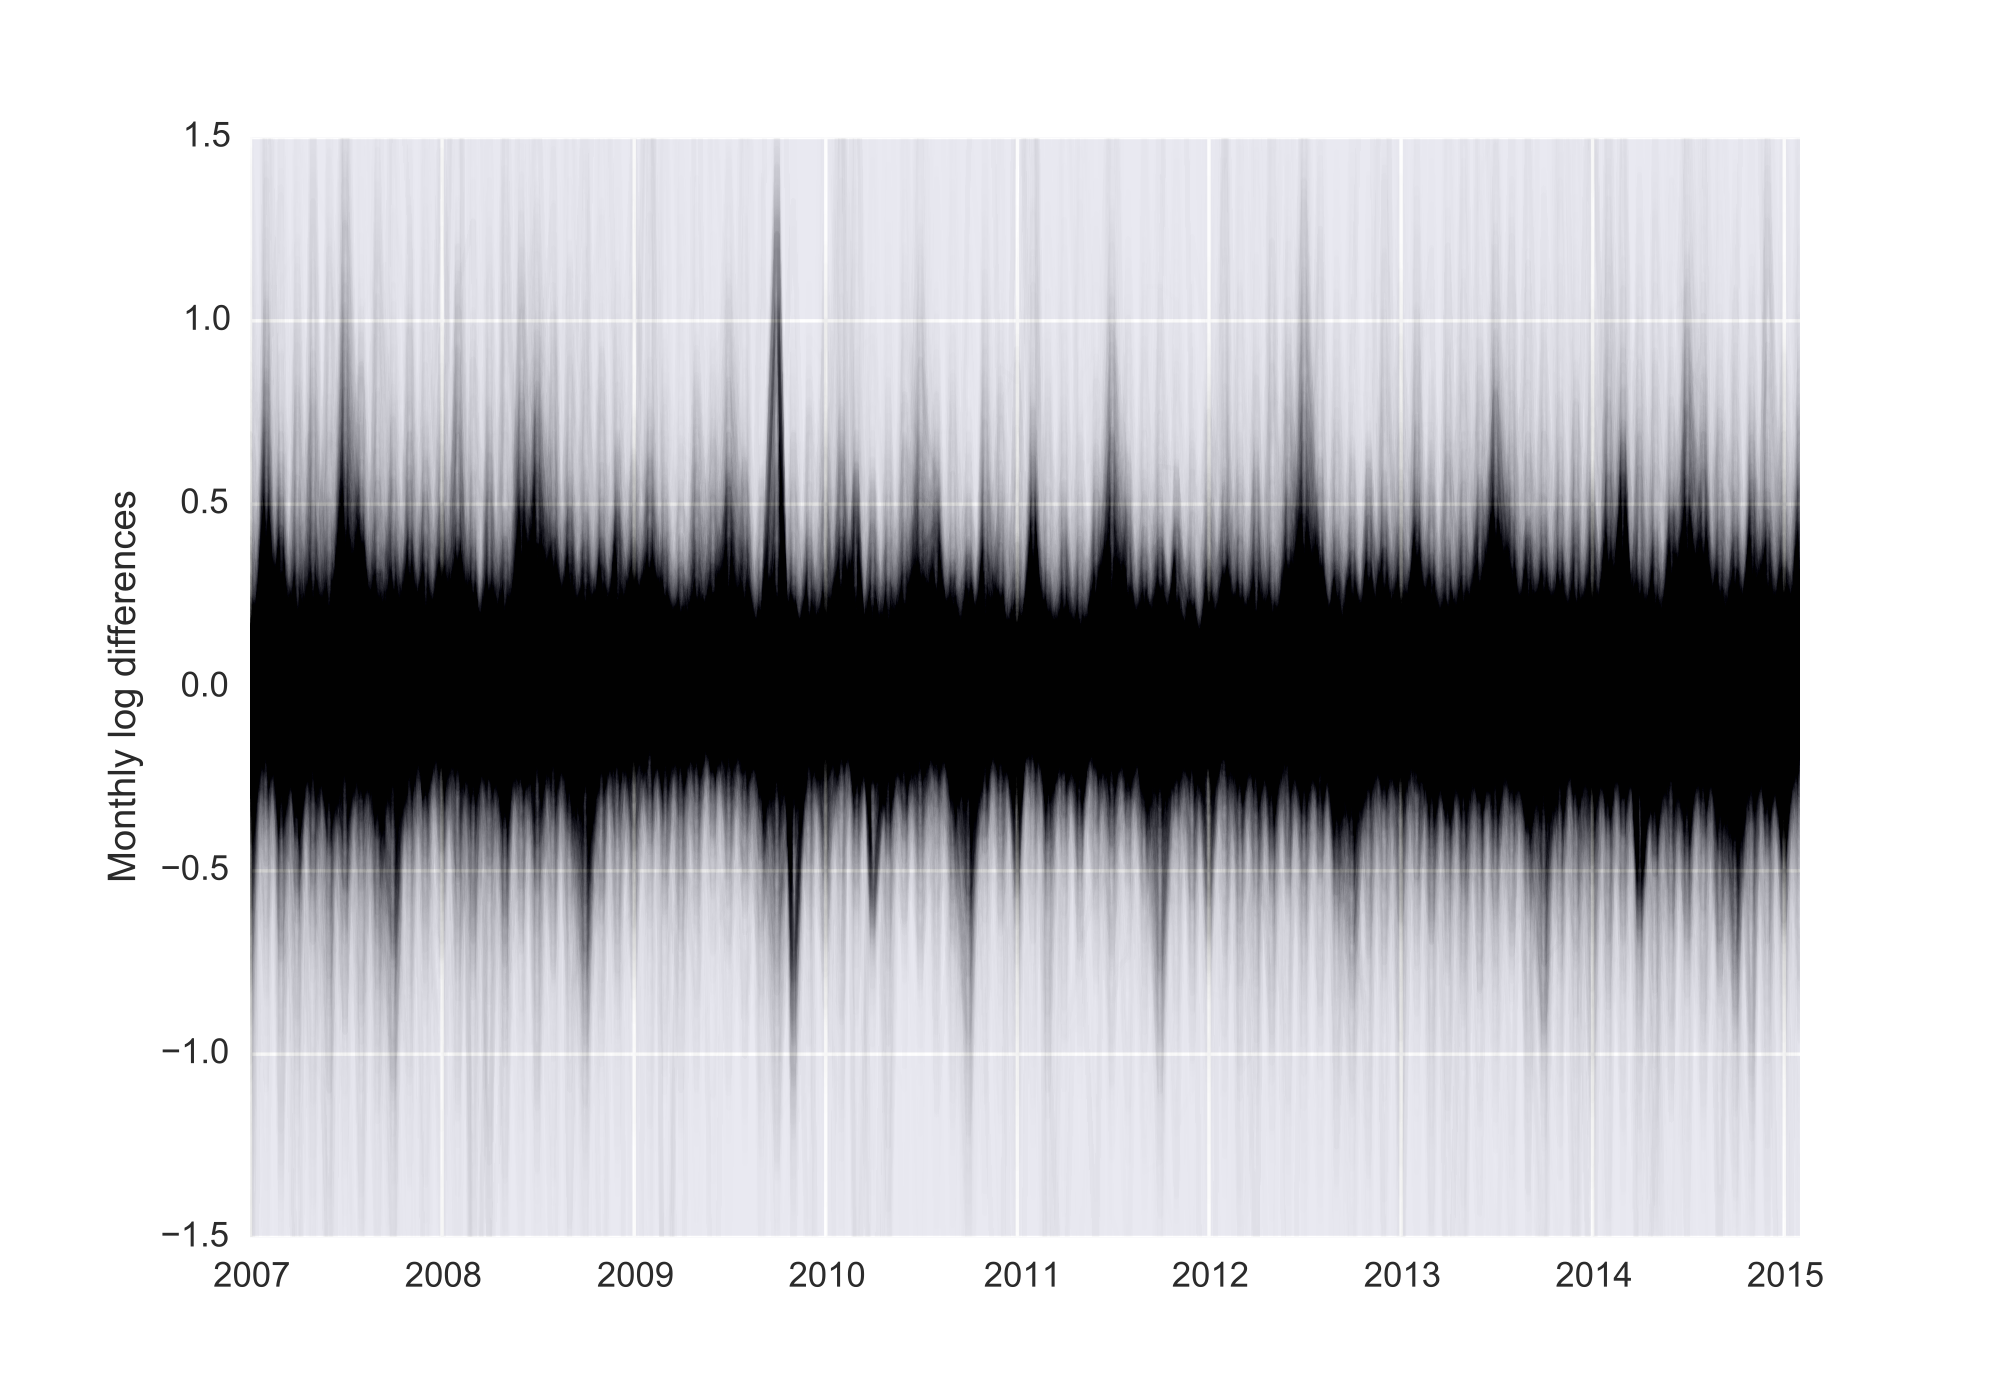
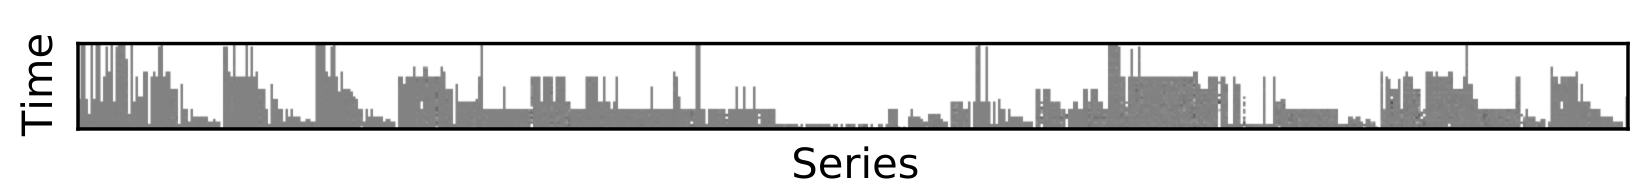
We really should just dump all the data into the computer and let the computer sort it out. Of course, a model with 14,000+ variables will be guaranteed to overfit as there are more variables than time periods. No problem, use dimension reduction. Unfortunately, PCA doesn’t work with missing data. Time series often start and end at different points, missing data is randomly interspersed throughout and they may or may not be seasonally adjusted. The cheap solution of univariate interpolation or replacing NaNs with means isn't a great idea if missing data is common. For reference, from 2007, 65 percent of data from series dating back to 1948 are missing in the CPS.
No problem, use a flavor of Probabilistic PCA that is robust to missing data (see Ilin and Raiko 2010). Rather than the vanilla one-shot SVD, PPCA uses an iterative EM procedure/fixed point algorithm. From an initial guess, it’ll alternatively interpolate missing data and update the components until convergence.
On a side note, PPCA interpolates using information from all series, making it a multivariate interpolator. Be careful though, fitting the model to too many components will likely lead to overfitting problems in the interpolated data.
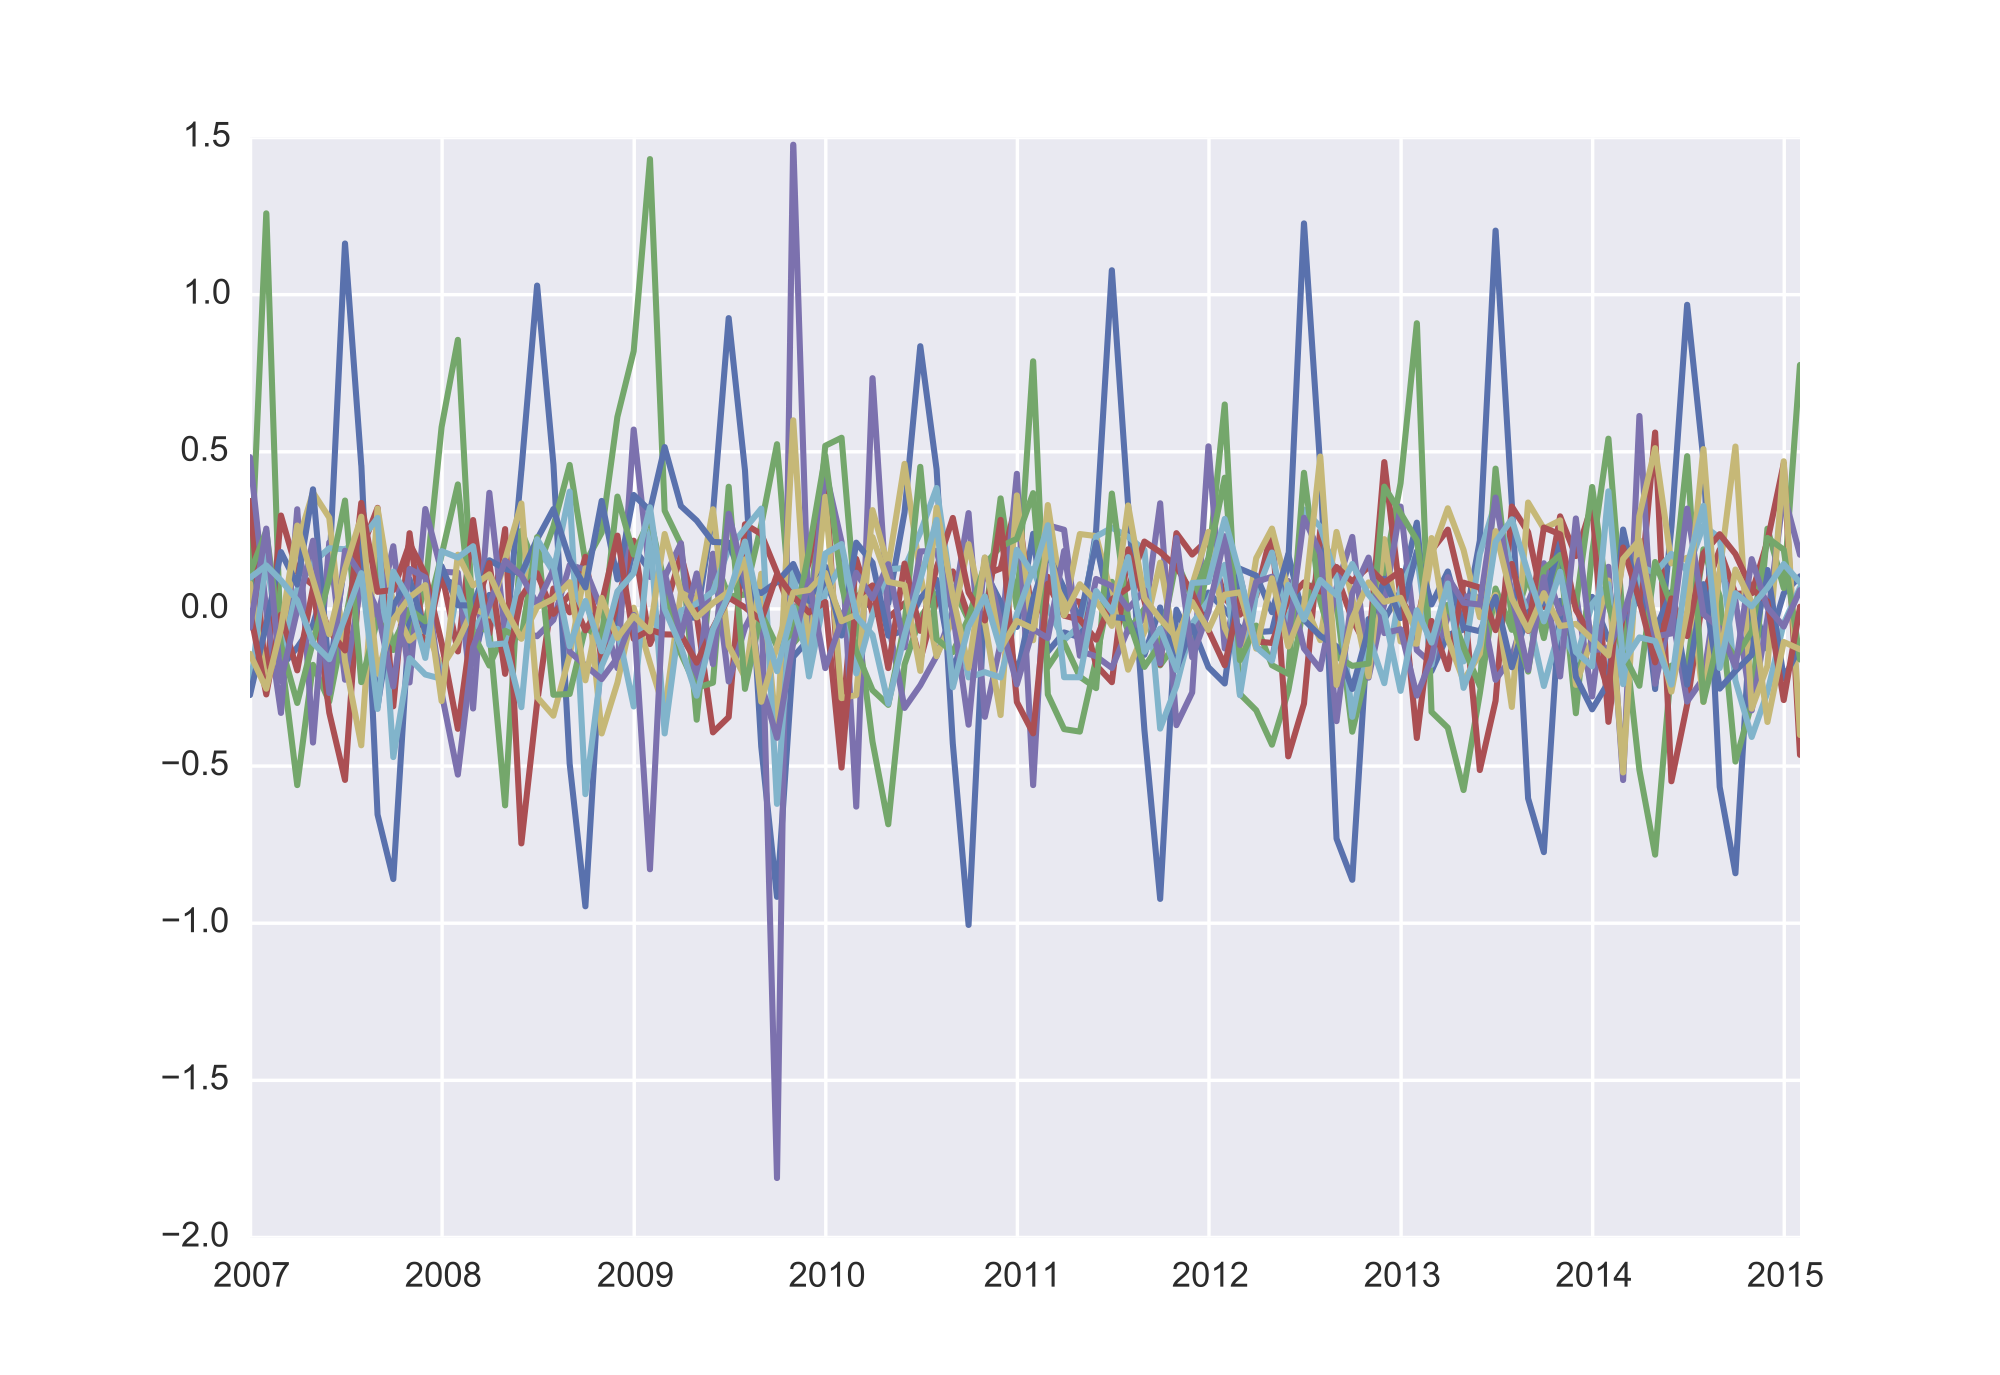
The Scikit-Learn version doesn't handle missing data so I rolled my own here. The chart above shows 10 components from the 14,000+ monthly series in the CPS. 93 components (less than 0.6% the size of the dataset) explain over 90% of the variance in the entire dataset. It’s obvious some crazy stuff went down in 2008/9 while it also picks up seasonal factors (that vary over time unlike typical seasonal adjustment which is univariate).
Hopefully you found this useful as there really is a ton of messy economic/finance data to play with. I’ll leave it up to you to ensure a model with something like 93 factors doesn’t overfit. I already have a "better than the RBA" model of first release GDP and CPI but I’d have to kill you.